🔧 阿川の電商水電行

資料管道是任何資料密集型專案的支柱。 隨著資料集的成長超出記憶體大小(「核心外」),有效處理它們變得具有挑戰性。
Dask 可以輕鬆管理大型資料集(核心外),提供與 Numpy 和 Pandas 的良好相容性。

本文重點介紹 Dask(用於處理核心外資料)與 Taipy 的無縫集成,Taipy 是一個用於 管道編排和場景管理** 的 Python 庫。
Taipy - 您的 Web 應用程式建構器
關於我們的一些資訊。 Taipy 是一個開源程式庫,旨在輕鬆開發前端 (GUI) 和 ML/資料管道。
不需要其他知識(沒有 CSS,什麼都不需要!)。
它旨在加快應用程式開發,從最初的原型到生產就緒的應用程式。

https://github.com/Avaiga/taipy
我們已經快有 1000 顆星了,沒有你就無法做到這一點🙏
1. 範例應用程式
透過範例最好地演示了 Dask 和 Taipy 的整合。在本文中,我們將考慮包含 4 個任務的資料工作流程:
-
資料預處理與客戶評分
使用 Dask 讀取和處理大型資料集。
-
特徵工程和分割
根據購買行為對客戶進行評分。
-
細分分析
根據這些分數和其他因素將客戶分為不同的類別。
-
高價值客戶的總統計
分析每個客戶群以獲得見解
我們將更詳細地探討這 4 個任務的程式碼。
請注意,此程式碼是您的 Python 程式碼,並未使用 Taipy。
在後面的部分中,我們將展示如何使用 Taipy 對現有資料應用程式進行建模,並輕鬆獲得其工作流程編排的好處。
該應用程式將包含以下 5 個檔案:
algos/
├─ algo.py  #  Our existing code with 4 tasks
data/
├─ SMALL_amazon_customers_data.csv  #  A sample dataset
app.ipynb  # Jupyter Notebook for running our sample data application
config.py  # Taipy configuration which models our data workflow
config.toml  # (Optional) Taipy configuration in TOML made using Taipy Studio
2. Taipy 簡介 - 綜合解決方案
Taipy 不只是另一個編排工具。
Taipy 專為 ML 工程師、資料科學家和 Python 開發人員設計,帶來了幾個基本且簡單的功能。
以下是一些關鍵要素,使 Taipy 成為令人信服的選擇:
- 管道執行註冊表
此功能使開發人員和最終用戶能夠:
 - 將每個管道執行註冊為「*場景*」(任務和資料節點圖);

 - 精確追蹤每個管道執行的沿襲;和

- 輕鬆比較場景、監控 KPI 並為故障排除和微調參數提供寶貴的見解。- 管道版本控制
Taipy 強大的場景管理使您能夠輕鬆調整管道以適應不斷變化的專案需求。
- 智能任務編排
Taipy 讓開發人員可以輕鬆地對任務和資料來源網路進行建模。
此功能透過以下方式提供對任務執行的內建控制:
 - 並行執行您的任務;和

 - 任務“跳過”,即選擇要執行的任務並
要繞過哪個。
- 任務編排的模組化方法
模組化不僅僅是 Taipy 的一個流行詞;這是一個核心原則。
設定可以互換使用的任務和資料來源,從而產生更乾淨、更易於維護的程式碼庫。
3. Dask 簡介
Dask 是一個流行的分散式運算 Python 套件。 Dask API 實作了熟悉的 Pandas、Numpy 和 Scikit-learn API - ,這使得許多已經熟悉這些 API 的資料科學家更愉快地學習和使用 Dask。
如果您是 Dask 新手,請查看 Dask 團隊撰寫的精彩 Dask 10 分鐘簡介。
4. 應用:顧客分析 (algos/algo.py)
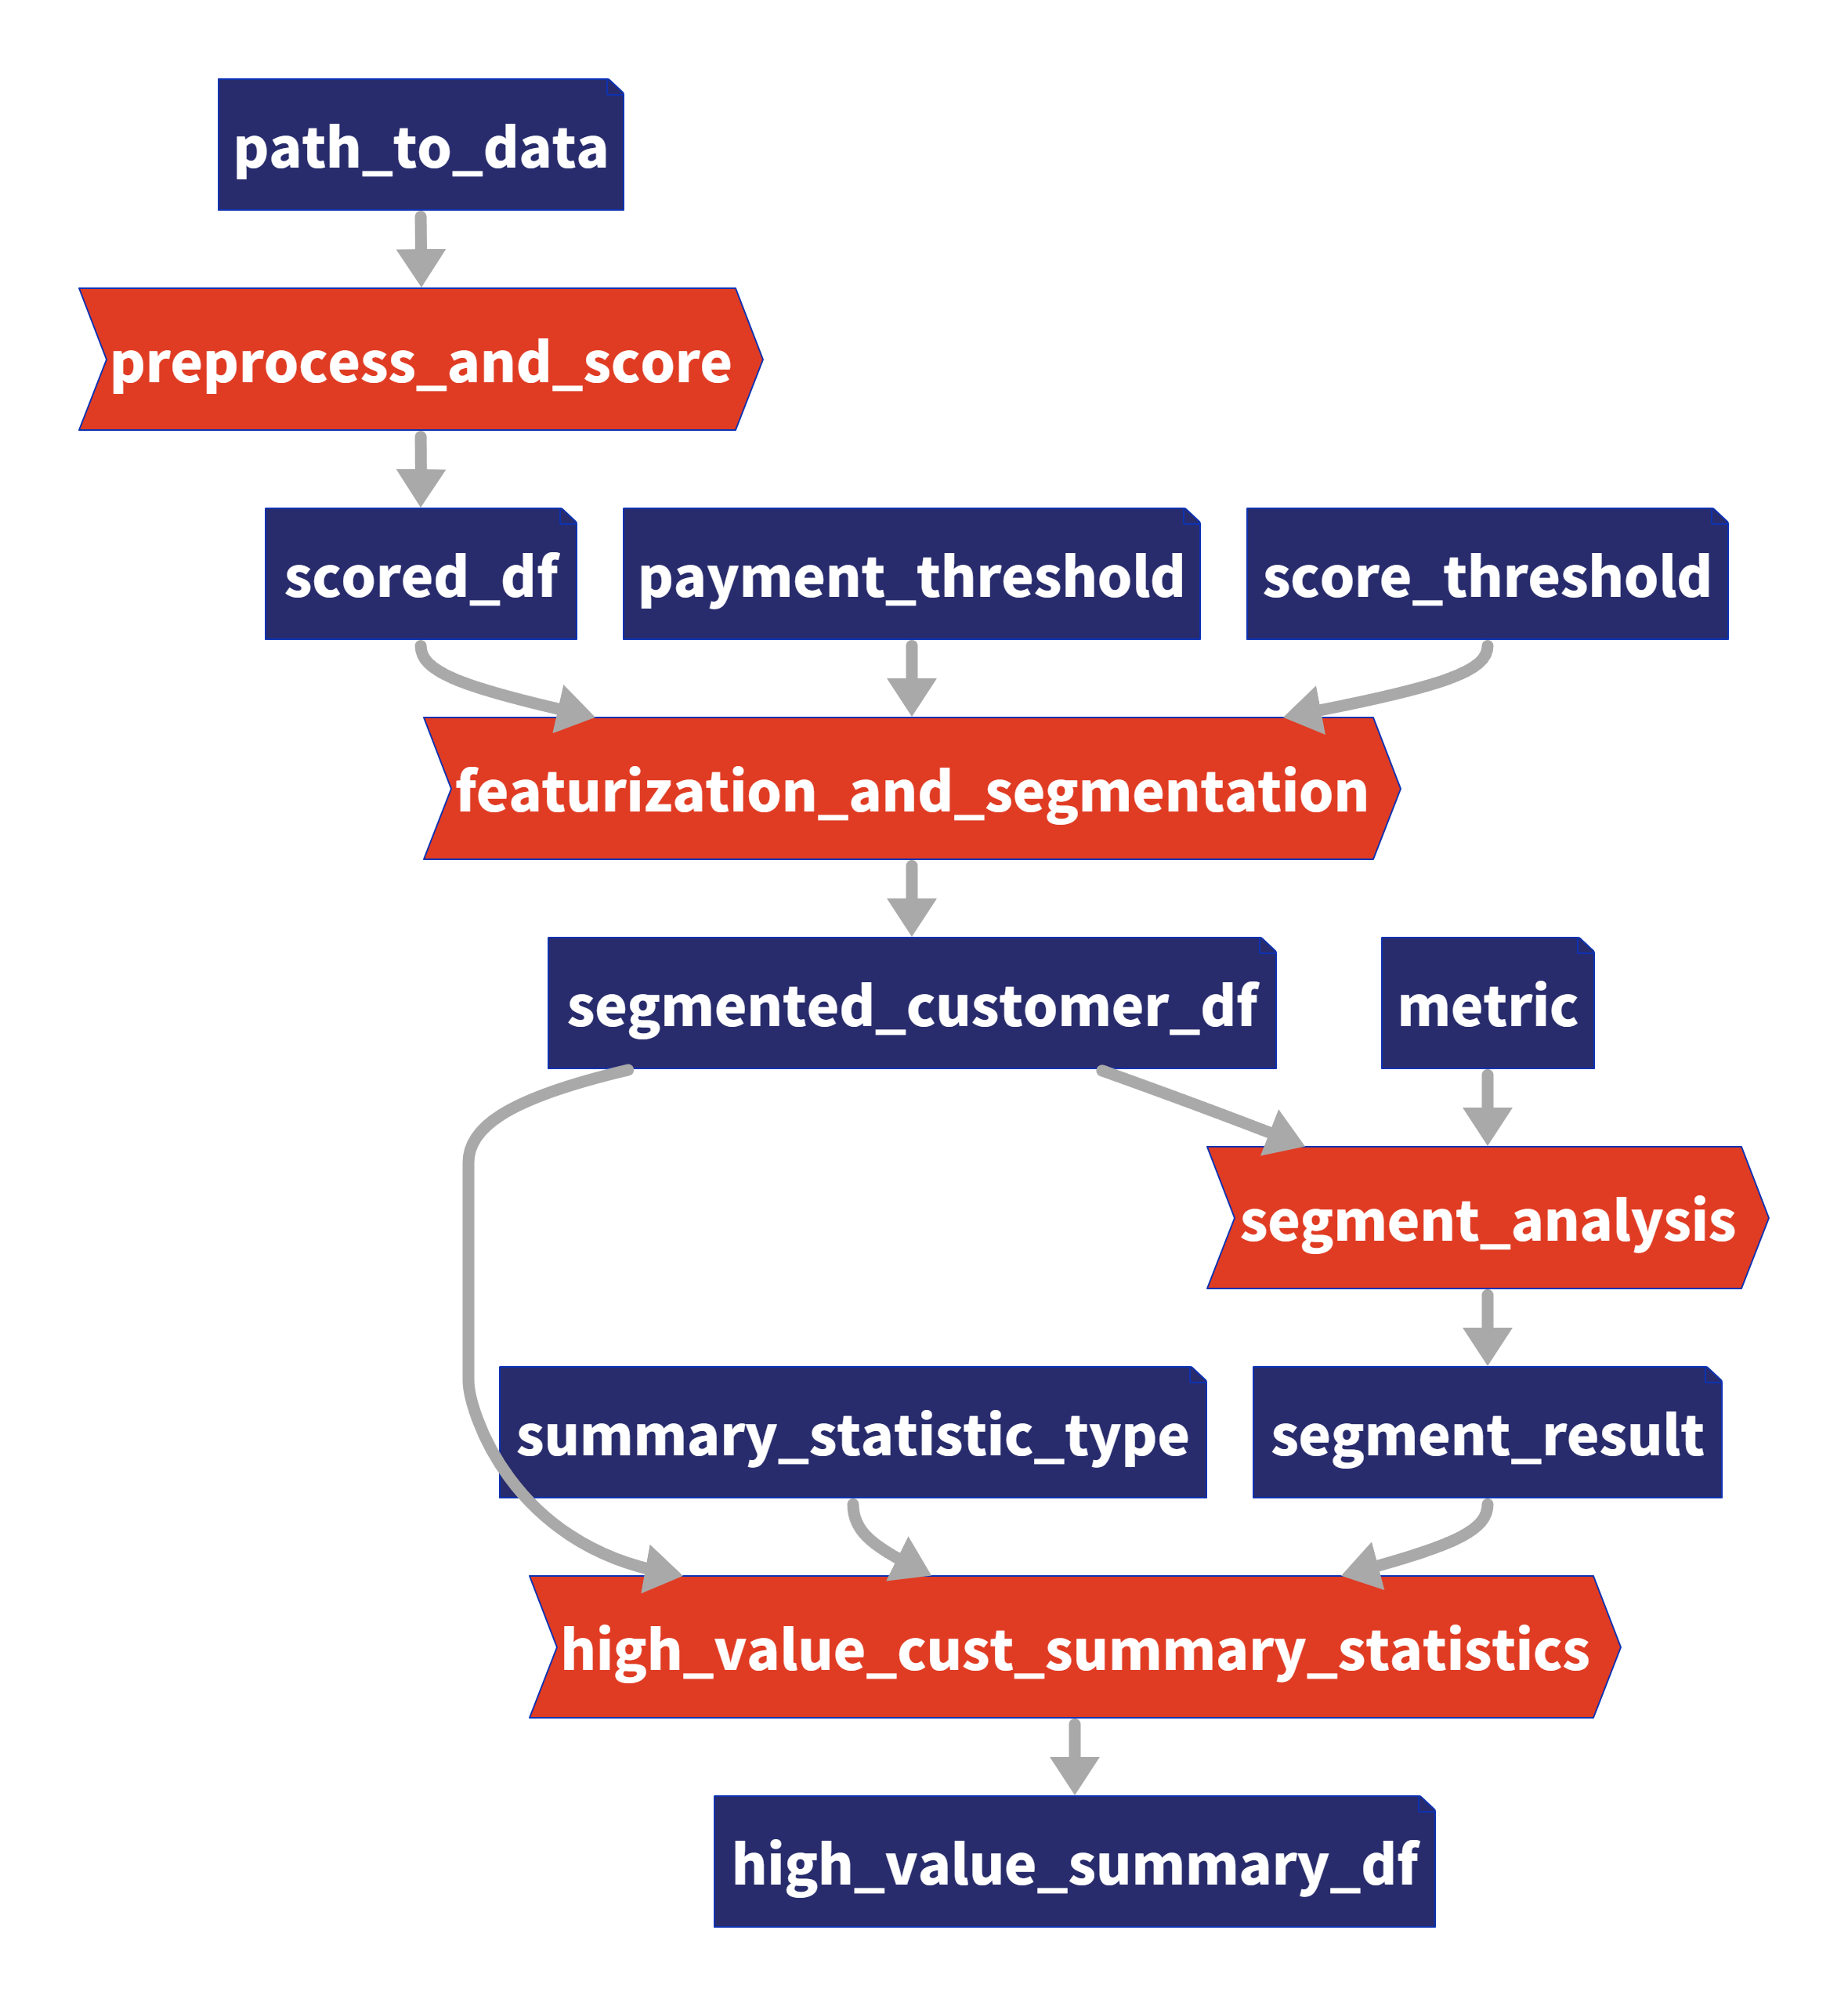
我們的 4 項任務的圖表(在 Taipy 中可視化),我們將在下一節中對其進行建模。
我們現有的程式碼(不含 Taipy)包含 4 個函數,您也可以在上圖中看到:
-
任務 1:預處理和評分
-
任務 2:特徵化與細分
-
任務 3:分段分析
-
任務 4:high_value_cust_summary_statistics
您可以瀏覽以下定義了 4 個函數的 algos/algo.py 腳本,然後繼續閱讀每個函數的簡要說明:
### algos/algo.py
import time

import dask.dataframe as dd
import pandas as pd

def preprocess_and_score(path_to_original_data: str):
    print("__________________________________________________________")
    print("1. TASK 1: DATA PREPROCESSING AND CUSTOMER SCORING ...")
    start_time = time.perf_counter()  # Start the timer

    # Step 1: Read data using Dask
    df = dd.read_csv(path_to_original_data)

    # Step 2: Simplify the customer scoring formula
    df["CUSTOMER_SCORE"] = (
        0.5 * df["TotalPurchaseAmount"] / 1000 + 0.3 * df["NumberOfPurchases"] / 10 + 0.2 * df["AverageReviewScore"]
    )

    # Save all customers to a new CSV file
    scored_df = df[["CUSTOMER_SCORE", "TotalPurchaseAmount", "NumberOfPurchases", "TotalPurchaseTime"]]

    pd_df = scored_df.compute()

    end_time = time.perf_counter()  # Stop the timer
    execution_time = (end_time - start_time) * 1000  # Calculate the time in milliseconds
    print(f"Time of Execution: {execution_time:.4f} ms")

    return pd_df

def featurization_and_segmentation(scored_df, payment_threshold, score_threshold):
    print("__________________________________________________________")
    print("2. TASK 2: FEATURE ENGINEERING AND SEGMENTATION ...")

    # payment_threshold, score_threshold = float(payment_threshold), float(score_threshold)
    start_time = time.perf_counter()  # Start the timer

    df = scored_df

    # Feature: Indicator if customer's total purchase is above the payment threshold
    df["HighSpender"] = (df["TotalPurchaseAmount"] > payment_threshold).astype(int)

    # Feature: Average time between purchases
    df["AverageTimeBetweenPurchases"] = df["TotalPurchaseTime"] / df["NumberOfPurchases"]

    # Additional computationally intensive features
    df["Interaction1"] = df["TotalPurchaseAmount"] * df["NumberOfPurchases"]
    df["Interaction2"] = df["TotalPurchaseTime"] * df["CUSTOMER_SCORE"]
    df["PolynomialFeature"] = df["TotalPurchaseAmount"] ** 2

    # Segment customers based on the score_threshold
    df["ValueSegment"] = ["High Value" if score > score_threshold else "Low Value" for score in df["CUSTOMER_SCORE"]]

    end_time = time.perf_counter()  # Stop the timer
    execution_time = (end_time - start_time) * 1000  # Calculate the time in milliseconds
    print(f"Time of Execution: {execution_time:.4f} ms")

    return df

def segment_analysis(df: pd.DataFrame, metric):
    print("__________________________________________________________")
    print("3. TASK 3: SEGMENT ANALYSIS ...")
    start_time = time.perf_counter()  # Start the timer

    # Detailed analysis for each segment: mean/median of various metrics
    segment_analysis = (
        df.groupby("ValueSegment")
        .agg(
            {
                "CUSTOMER_SCORE": metric,
                "TotalPurchaseAmount": metric,
                "NumberOfPurchases": metric,
                "TotalPurchaseTime": metric,
                "HighSpender": "sum",  # Total number of high spenders in each segment
                "AverageTimeBetweenPurchases": metric,
            }
        )
        .reset_index()
    )

    end_time = time.perf_counter()  # Stop the timer
    execution_time = (end_time - start_time) * 1000  # Calculate the time in milliseconds
    print(f"Time of Execution: {execution_time:.4f} ms")

    return segment_analysis

def high_value_cust_summary_statistics(df: pd.DataFrame, segment_analysis: pd.DataFrame, summary_statistic_type: str):
    print("__________________________________________________________")
    print("4. TASK 4: ADDITIONAL ANALYSIS BASED ON SEGMENT ANALYSIS ...")
    start_time = time.perf_counter()  # Start the timer

    # Filter out the High Value customers
    high_value_customers = df[df["ValueSegment"] == "High Value"]

    # Use summary_statistic_type to calculate different types of summary statistics
    if summary_statistic_type == "mean":
        average_purchase_high_value = high_value_customers["TotalPurchaseAmount"].mean()
    elif summary_statistic_type == "median":
        average_purchase_high_value = high_value_customers["TotalPurchaseAmount"].median()
    elif summary_statistic_type == "max":
        average_purchase_high_value = high_value_customers["TotalPurchaseAmount"].max()
    elif summary_statistic_type == "min":
        average_purchase_high_value = high_value_customers["TotalPurchaseAmount"].min()

    median_score_high_value = high_value_customers["CUSTOMER_SCORE"].median()

    # Fetch the summary statistic for 'TotalPurchaseAmount' for High Value customers from segment_analysis
    segment_statistic_high_value = segment_analysis.loc[
        segment_analysis["ValueSegment"] == "High Value", "TotalPurchaseAmount"
    ].values[0]

    # Create a DataFrame to hold the results
    result_df = pd.DataFrame(
        {
            "SummaryStatisticType": [summary_statistic_type],
            "AveragePurchaseHighValue": [average_purchase_high_value],
            "MedianScoreHighValue": [median_score_high_value],
            "SegmentAnalysisHighValue": [segment_statistic_high_value],
        }
    )

    end_time = time.perf_counter()  # Stop the timer
    execution_time = (end_time - start_time) * 1000  # Calculate the time in milliseconds
    print(f"Time of Execution: {execution_time:.4f} ms")

    return result_df
任務 1 - 資料預處理與客戶評分
Python 函數:preprocess_and_score
這是管道中的第一步,也許也是最關鍵的一步。
它使用 Dask 讀取大型資料集,專為大於記憶體的計算而設計。
然後,它根據“TotalPurchaseAmount”、“NumberOfPurchases”和“AverageReviewScore”等各種指標,在名為 scored_df 的 DataFrame 中計算“Customer Score”。
使用 Dask 讀取和處理資料集後,此任務將輸出一個 Pandas DataFrame,以供其餘 3 個任務進一步使用。
任務 2 - 特徵工程與分割
Python 函數:featureization_and_segmentation
此任務採用評分的 DataFrame 並新增功能,例如高支出指標。
它還根據客戶的分數對客戶進行細分。
任務 3 - 細分分析
Python 函數:segment_analysis
此任務採用分段的 DataFrame 並根據客戶細分執行分組分析以計算各種指標。
任務 4 - 高價值客戶的總統計
Python 函數:high_value_cust_summary_statistics
此任務對高價值客戶群進行深入分析並傳回匯總統計資料。
5. 在 Taipy 中建模工作流程 (config.py)
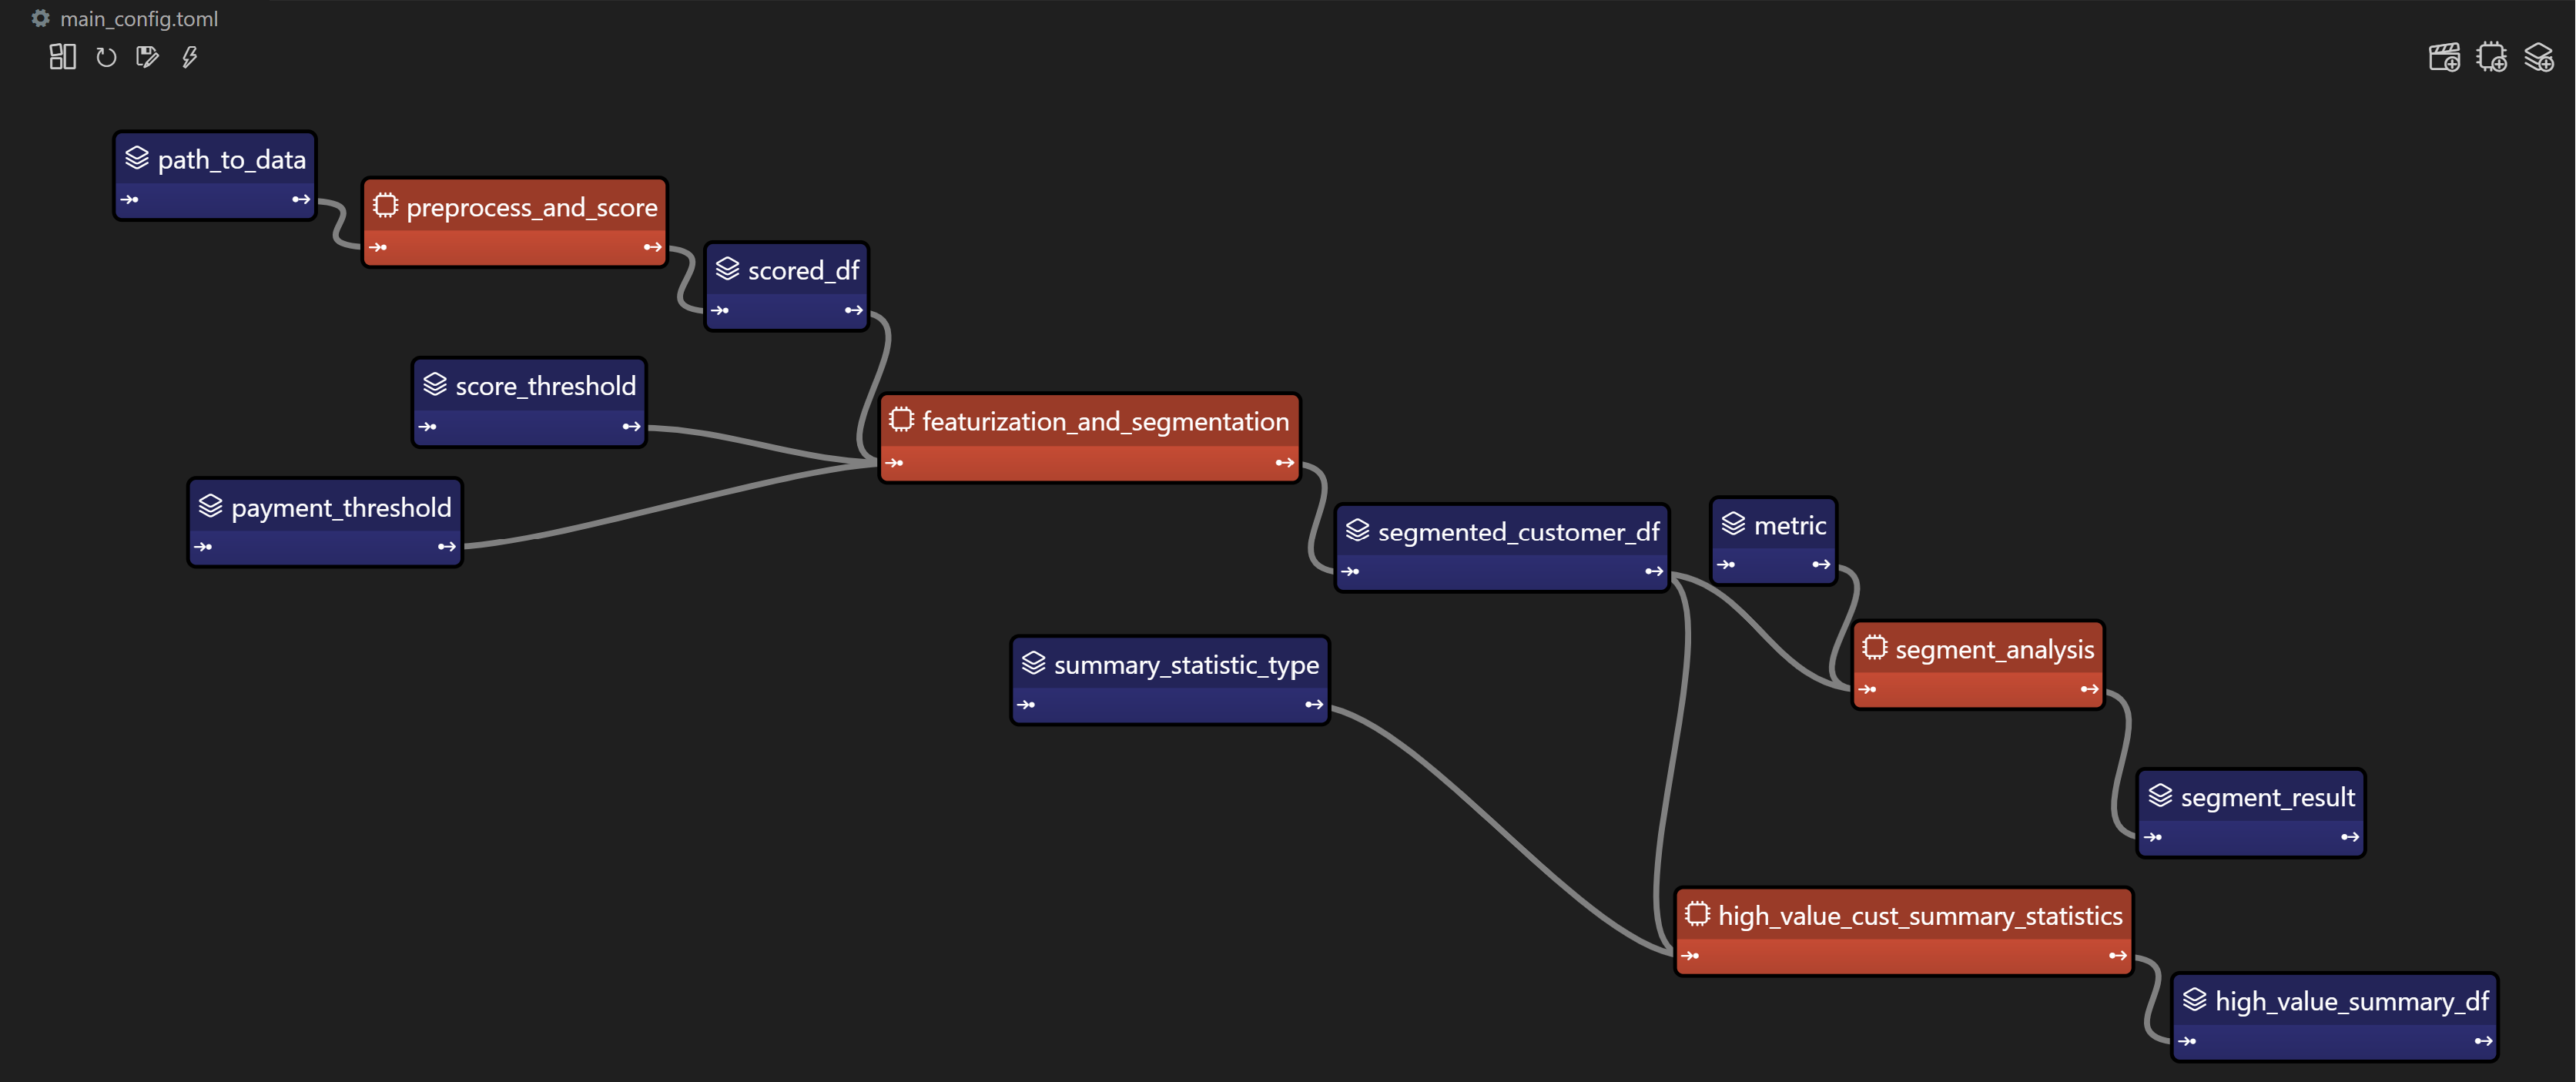
Taipy DAG — Taipy「任務」為橘色,「資料節點」為藍色。
在本節中,我們將建立對變數/參數進行建模的Taipy 配置(表示為“資料節點”)和 Taipy 中的函數(表示為 “Tasks”)。
請注意,以下 config.py 腳本中的此配置類似於定義變數和函數 - 只不過我們定義的是「藍圖變數」(資料節點)和「藍圖函數」(任務)。
我們通知 Taipy 如何呼叫我們之前定義的函數、資料節點的預設值(我們可能會在執行時覆蓋)以及是否可以跳過任務:
### config.py
from taipy import Config

from algos.algo import (
    preprocess_and_score,
    featurization_and_segmentation,
    segment_analysis,
    high_value_cust_summary_statistics,
)

# -------------------- Data Nodes --------------------

path_to_data_cfg = Config.configure_data_node(id="path_to_data", default_data="data/customers_data.csv")

scored_df_cfg = Config.configure_data_node(id="scored_df")

payment_threshold_cfg = Config.configure_data_node(id="payment_threshold", default_data=1000)

score_threshold_cfg = Config.configure_data_node(id="score_threshold", default_data=1.5)

segmented_customer_df_cfg = Config.configure_data_node(id="segmented_customer_df")

metric_cfg = Config.configure_data_node(id="metric", default_data="mean")

segment_result_cfg = Config.configure_data_node(id="segment_result")

summary_statistic_type_cfg = Config.configure_data_node(id="summary_statistic_type", default_data="median")

high_value_summary_df_cfg = Config.configure_data_node(id="high_value_summary_df")

# -------------------- Tasks --------------------

preprocess_and_score_task_cfg = Config.configure_task(
    id="preprocess_and_score",
    function=preprocess_and_score,
    skippable=True,
    input=[path_to_data_cfg],
    output=[scored_df_cfg],
)

featurization_and_segmentation_task_cfg = Config.configure_task(
    id="featurization_and_segmentation",
    function=featurization_and_segmentation,
    skippable=True,
    input=[scored_df_cfg, payment_threshold_cfg, score_threshold_cfg],
    output=[segmented_customer_df_cfg],
)

segment_analysis_task_cfg = Config.configure_task(
    id="segment_analysis",
    function=segment_analysis,
    skippable=True,
    input=[segmented_customer_df_cfg, metric_cfg],
    output=[segment_result_cfg],
)

high_value_cust_summary_statistics_task_cfg = Config.configure_task(
    id="high_value_cust_summary_statistics",
    function=high_value_cust_summary_statistics,
    skippable=True,
    input=[segment_result_cfg, segmented_customer_df_cfg, summary_statistic_type_cfg],
    output=[high_value_summary_df_cfg],
)

scenario_cfg = Config.configure_scenario(
    id="scenario_1",
    task_configs=[
        preprocess_and_score_task_cfg,
        featurization_and_segmentation_task_cfg,
        segment_analysis_task_cfg,
        high_value_cust_summary_statistics_task_cfg,
    ],
)
號
您可以在此處的文件中閱讀有關配置場景、任務和資料節點的更多資訊。
Taipy Studio
Taipy Studio 是來自Taipy 的VS Code 擴充功能,讓您透過簡單的方式建置和視覺化您的管道拖放互動。
Taipy Studio 提供了一個圖形編輯器,您可以在其中建立 Taipy 配置存儲在 TOML 文件中,您的 Taipy 應用程式可以加載並執行這些配置。
編輯器將場景表示為圖形,其中節點是資料節點和任務。
*作為本節中 config.py 腳本的替代方案,您可以使用 Taipy Studio 產生 config.toml 設定檔。
本文的倒數第二部分將提供有關如何使用 Taipy Studio 建立 config.toml 設定檔的指南。*
6. 場景建立與執行
執行 Taipy 場景涉及:
-
載入配置;
-
執行 Taipy Core 服務;和
-
建立並提交場景以供執行。
這是基本的程式碼模板:
import taipy as tp
from config import scenario_cfg  # Import the Scenario configuration
tp.Core().run()  # Start the Core service
scenario_1 = tp.create_scenario(scenario_cfg)  # Create a Scenario instance
scenario_1.submit()  # Submit the Scenario for execution

# Total runtime: 74.49s
跳過不必要的任務執行
Taipy 最實用的功能之一是,如果任務的輸出已經計算出來,它能夠跳過任務執行。
讓我們透過一些場景來探討這一點:
更改付款閾值
# Changing Payment Threshold to 1600
scenario_1.payment_threshold.write(1600)
scenario_1.submit()

# Total runtime: 31.499s發生了什麼事:Taipy 夠聰明,可以跳過任務 1,因為付款閾值只影響任務 2。
在這種情況下,透過使用 Taipy 執行管道,我們發現執行時間減少了 50% 以上。
更改細分分析指標
# Changing metric to median
scenario_1.metric.write("median")
scenario_1.submit()

# Total runtime: 23.839s會發生什麼事:在這種情況下,只有任務 3 和任務 4 受到影響。 Taipy 巧妙地跳過任務 1 和任務 2。
更改總計統計類型
# Changing summary_statistic_type to max
scenario_1.summary_statistic_type.write("max")
scenario_1.submit()

# Total runtime: 5.084s發生了什麼事:這裡,只有任務 4 受到影響,Taipy 僅執行此任務,跳過其餘任務。
Taipy 的智慧任務跳過功能不僅能節省時間,還能節省時間。它是一個資源優化器,在處理大型資料集時變得非常有用。
7. Taipy Studio
您可以使用 Taipy Studio 建置 Taipy config.toml 設定檔來取代定義 config.py 腳本。
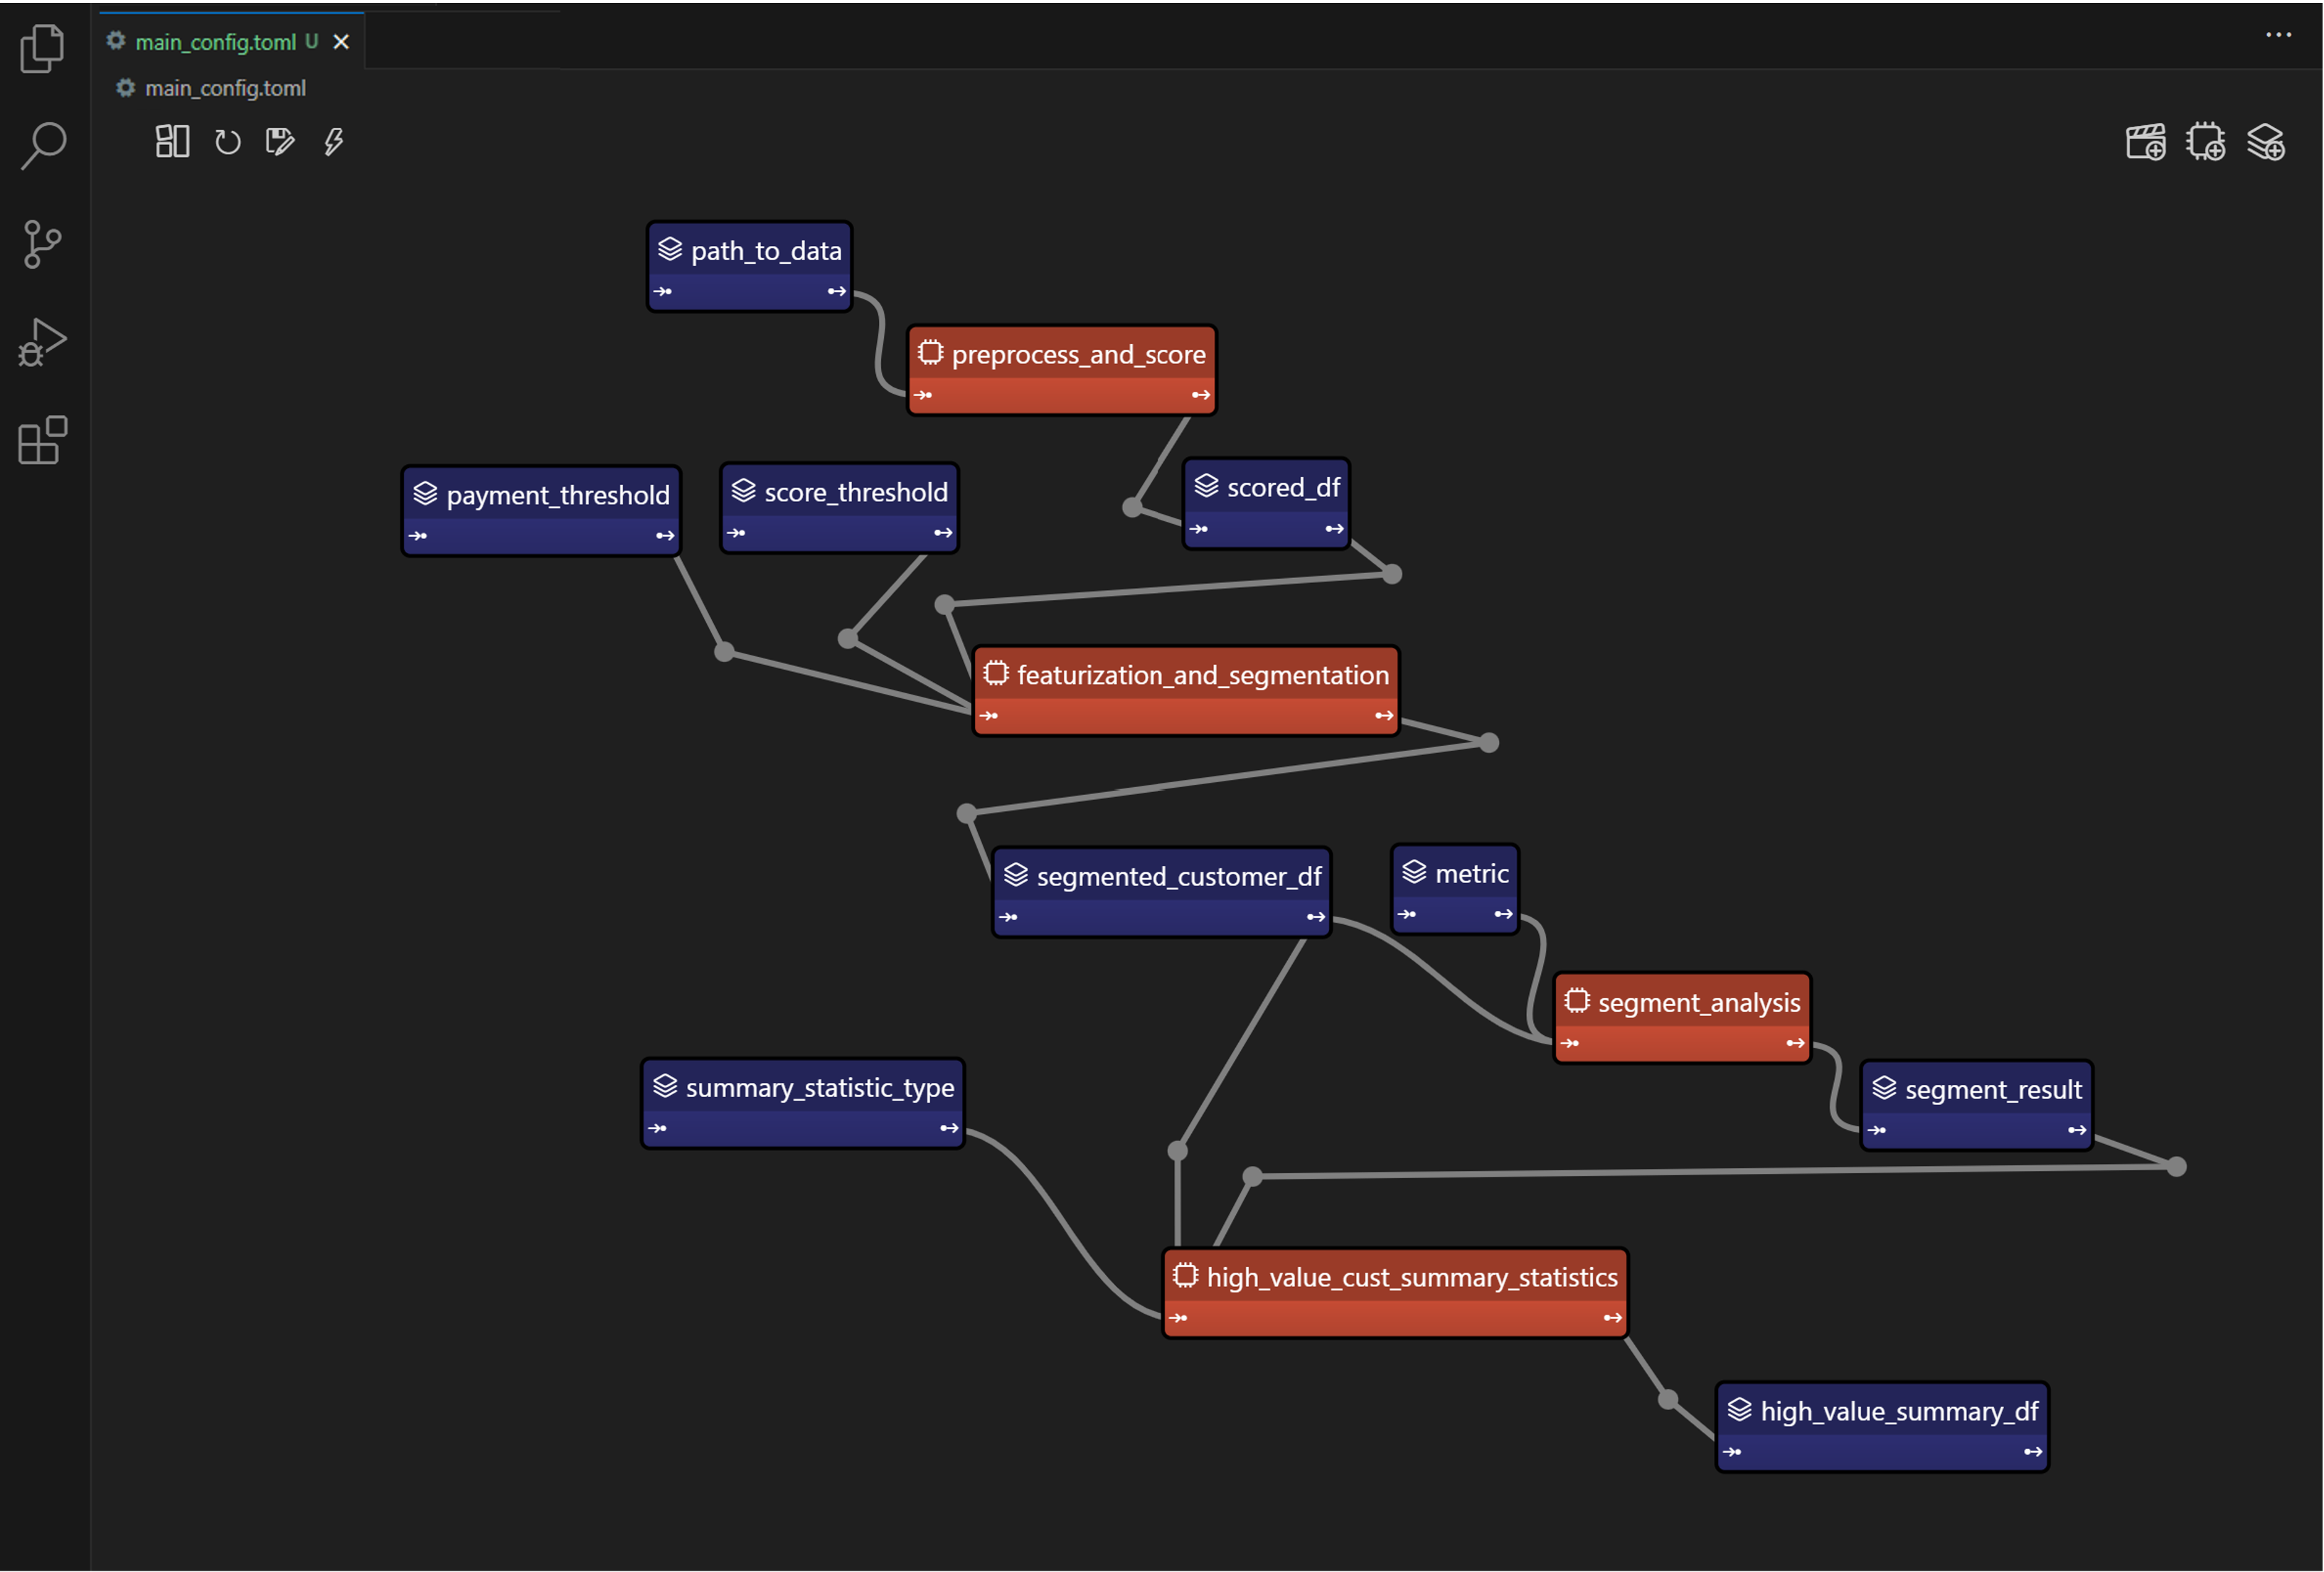
首先,使用擴展市場安裝 Taipy Studio 擴充。
建立配置
- 建立設定檔:在 VS Code 中,導覽至 Taipy Studio,然後透過點擊參數視窗上的 + 按鈕啟動新的 TOML 設定檔。
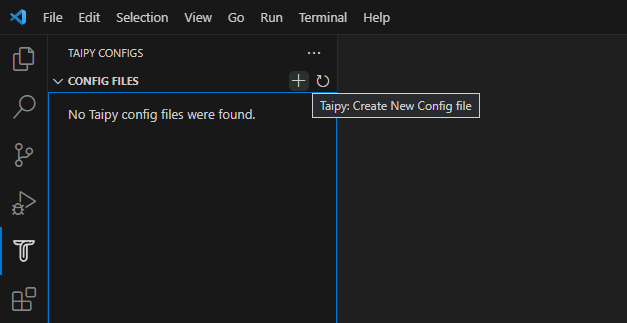
- 然後右鍵單擊它並選擇 Taipy:顯示視圖。

- 新增實體到您的 Taipy 配置:
在 Taipy Studio 的右側,您應該會看到一個包含 3 個圖示的列表,可用於設定管道。

-
第一項是新增資料節點。您可以將任何 Python 物件連結到 Taipy 的資料節點。
-
第二項用於新增任務。任務可以連結到預先定義的 Python 函數。
-
第三項是新增場景。 Taipy 讓您在一個配置中擁有多個場景。
- 資料節點
輸入資料節點:建立一個名為“path_to_data”的資料節點,然後導航到“詳細資料”選項卡,新增屬性“default_data”,並將“SMALL_amazon_customers_data.csv”貼上為您的資料的路徑資料集。
中間資料節點:我們需要再增加四個資料節點:「scored_df」、「segmented_customer_df」、「segment_result」、「high_value_summary_df」。透過 Taipy 的智慧設計,您無需為這些中間資料節點進行任何配置;系統會巧妙地處理它們。
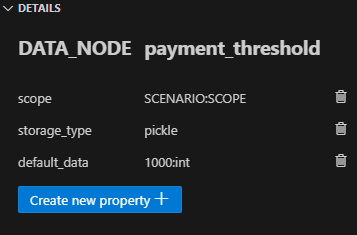
具有預設值的中間資料節點:我們最終定義了另外四個中間資料節點,並將「default_data」屬性設為以下內容:
- payment_threshold: “1000:int”
-
分數閾值:“1.5:浮動”
-
測量:“平均值”
-summary_statistic_type:“中位數”
- 任務
點擊新增任務按鈕,您可以配置新任務。
新增四個任務,然後將每個任務連結到「詳細資料」標籤下的對應函數。
Taipy Studio 將掃描您的專案資料夾並提供可供選擇的分類函數列表,並按 Python 檔案排序。
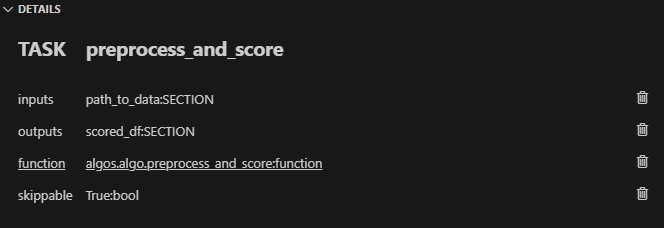
任務 1 (preprocess_and_score):在 Taipy studio 中,您可以按一下「任務」圖示以新增任務。
您可以將輸入指定為“path_to_data”,將輸出指定為“scored_df”。
然後,在「詳細資料」標籤下,您可以將此任務連結到 algos.algo.preprocess_and_score 函數。
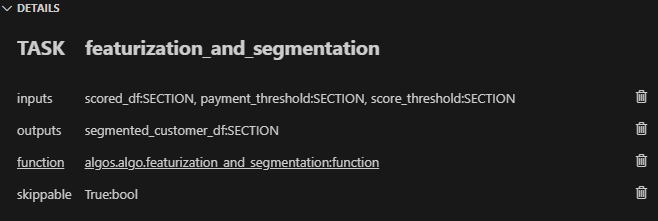
任務 2 (featurization_and_segmentation):與任務 1 類似,您需要指定輸入 (“scored_df”、“ payment_threshold”、“score_threshold”) 和輸出 (“segmented_customer_df”) ” )。將此任務連結到 algos.algo.featurization_and_segmentation 函數。
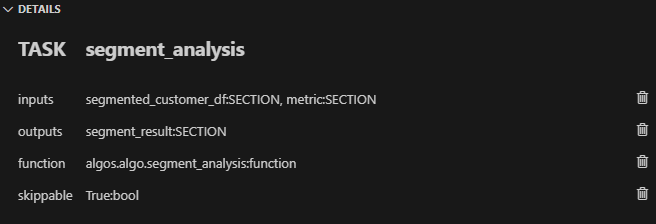
任務 3 (segment_analysis):輸入為“segmented_customer_df”和“metric”,輸出為“segment_result”。
連結到 algos.algo.segment_analysis 函數。
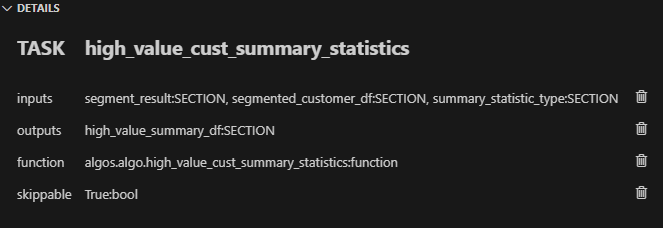
任務 4 (high_value_cust_summary_statistics):輸入包含「segment_result」、「segmented_customer_df」和「summary_statistic_type」。輸出為“high_value_summary_df”。連結到 algos.algo.high_value_cust_summary_statistics 函數。
結論
Taipy 提供了一種智慧方式來建立和管理資料管道。
特別是可跳過的功能使其成為優化運算資源和時間的強大工具,在涉及大型資料集的場景中特別有用。
Dask 提供了資料操作的原始能力,而 Taipy 增加了一層智能,使您的管道不僅強大而且智能。
其他資源
如需完整程式碼和 TOML 配置,您可以存取此 GitHub 儲存庫。若要深入了解 Taipy,請參閱官方文件。
一旦您了解 Taipy 場景管理,您就可以更有效率地為最終用戶建立資料驅動的應用程式。只需專注於您的演算法,Taipy 就會處理剩下的事情。

希望您喜歡這篇文章!
原文出處:https://dev.to/taipy/big-data-models-vs-computer-memory-4po6
1) --- 會變成分隔線(上一行必須是空白)
2) # 會變成一級標題
3) ## 會變成二級標題
4) ### 會變成三級標題
5) **粗體文字**會顯示粗體文字
6) ```當第一行與最後一行會顯示程式碼
7) 請搜尋 Markdown 語法,了解各種格式
